Observability is one of the concepts attached to modern cloud native applications. Applications logs are arguably the most important aspect of it. In this blog post I want to show you a variation of my current setup in the hope that it gives you ideas on how to pimp up your own applications as well. Reader discretion is advised as this blog contains vanilla Java code listings which some people might find disturbing.
Introduction
This blog is a walk-through of a Java application I wrote to illustrate how to output logs as newline-delimited JSON and incorporate tracing identifiers into your logs. The application is built on top of Logback, Jackson, Vert.x and the OpenTelemetry framework.
The end game is to produce logs like these:
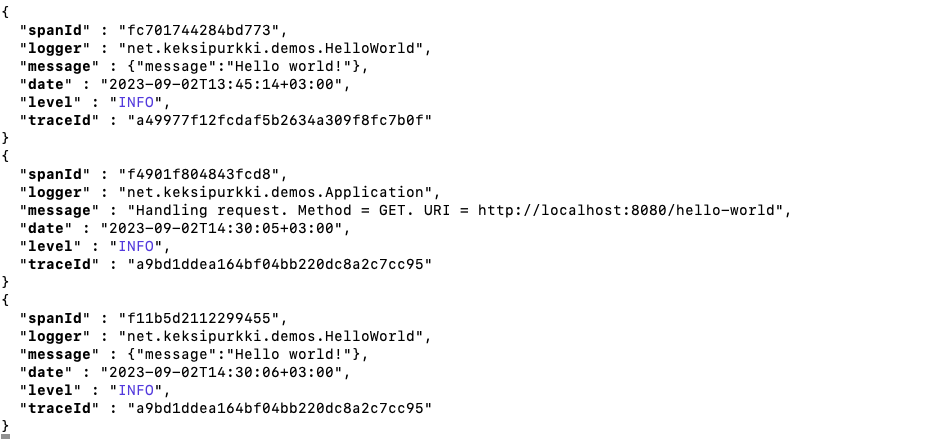
The color highlighting you see above is not a trick made for this blog. I took the extra steps to ensure that the requirement of machine-readability does not come at the expense of “human-readability.” I guess these tweaks make for the most interesting part of the blog, as all the other material I’ve read on this topic have left me a bit disappointed in the “developer experience” department.
The motivation to produce machine-readable logs in the first place is to make efficient log analysis possible. At work, we can have basically all our key performance indicators computed at the snap of a finger just by querying our logs. Think rate, error and duration for assessing how the software itself is doing. It is also vital to see an end-to-end trail of logs across different services, which is why request tracing is of importance.
Logging basics
In the Java world, the effective standard for logging goes by the name Simple Logging Facade for Java (SLF4J). There are alternatives but mistakes have been made.
The SLF4J approach to logging is to embrace the maxim code to an interface, not an implementation. You are only allowed to import classes from the SLF4J API in your own code. Then, by having a service provider of the SLF4J API in your classpath, the Java runtime knows how to relay calls to a logging implementation using dynamic dispatch.
The reference implementation of the SLF4J API is Logback. After installing it, you end up with code like this
package net.keksipurkki.demos;

import org.slf4j.Logger;
import org.slf4j.LoggerFactory;

public class Main {

    private static final Logger log = LoggerFactory.getLogger(Main.class);

    public static void main(String... args) {
        log.info("Starting {}", Main.class);
        System.exit(0);
    }
}
As for configuring the log output, you provide a configuration file called
logback.xml whose contents might look like something like this
<?xml version="1.0" encoding="UTF-8" ?>
<!DOCTYPE configuration>
<configuration>
  <appender name="STDOUT" class="ch.qos.logback.core.ConsoleAppender">
    <encoder class="ch.qos.logback.classic.encoder.PatternLayoutEncoder">
      <pattern>%date %logger %highlight(%level) %message %ex{short} %n</pattern>
    </encoder>
  </appender>

  <root level="DEBUG"">
    <appender-ref ref="STDOUT"/>
  </root>
</configuration>
The output from the application might then look like this:
2023-08-04 19:57:16,175 net.keksipurkki.demos.Main INFO Starting class net.keksipurkki.demos.Main
JSON lines
The plain text format for application logs is a bit ill-suited for analysing logs programmatically. To extract a particular value of interest, you would need to rely on regular expressions and the like. That’s why it has become standard practice to output the logs as JSON and dump them into a NoSQL database from which they can be queried later on. Sounds like a hassle, but in actuality this is what happens under the hood with no effort on your part when using a cloud provider.
To convert the log output to JSON lines format in the SLFJ4 paradigm, you would
have traditionally relied on the
Logback contrib library, no
doubt after reading the somewhat outdated
Baeldung tutorial about it. The
library provides a JsonLayout class that gets the job done. Nowadays, the
Logback core library itself
ships with a JsonEncoder as well so that enabling JSON output is in theory
only a matter of tweaking the configuration file.
  <appender name="JsonLinesContrib" class="ch.qos.logback.core.ConsoleAppender">
    <encoder class="ch.qos.logback.core.encoder.LayoutWrappingEncoder">
      <layout class="ch.qos.logback.contrib.json.classic.JsonLayout">
          <jsonFormatter class="ch.qos.logback.contrib.jackson.JacksonJsonFormatter">
              <prettyPrint>true</prettyPrint>
          </jsonFormatter>
      </layout>
    </encoder>
  </appender>

  <appender name="JsonLinesVanilla" class="ch.qos.logback.core.ConsoleAppender">
    <encoder class="ch.qos.logback.classic.encoder.JsonEncoder"/>
  </appender>

  <root>
    <!-- Change ref to change the implementation -->
    <appender-ref ref="JsonLinesVanilla"/>
  </root>
However, neither of these approaches quite does it for me. There are details related JSON serialization that neither of these solutions addresses.
It makes a difference if null values are serialized as the null symbol,
{ "prop": null }, or if they are simply omitted {}. In contrast, the output
from the JsonEncoder is very verbose with no apparent way to trim it down.
Using it would have a price tag attached to it when a single application
produces logs to the tune of million messages per day.
Then, there’s the pesky case of logging a JSON string that gets escaped by the logging library, resulting in logs like this:
{
  "timestamp" : "1691230909203",
  "level" : "INFO",
  "thread" : "vert.x-eventloop-thread-1",
  "logger" : "net.keksipurkki.demos.HelloWorld",
  "message" : "{\"message\":\"Hello world!\"}",
  "context" : "default"
}
Finally, both of the approaches provide some ways to add extra fields to the
logged output by relying on concepts like
Mapped Diagnostic Context or other
extension mechanisms, but this is not really what I want. I liked the way in
which the PatternLayoutEncoder lets you to just specify a self-documenting
pattern that can be modified to your heart’s content.
So, I rolled up my sleeves and decided to implement a custom JsonLineLayout
that can be configured with exactly the same kind of pattern string as
PatternLayoutEncoder. To my knowledge, nobody has come up with this brilliant
albeit nerdy realization before. As an extra bonus with this approach, one can
even highlight the logs with colors again!
Creating a custom layout
The starting point for a custom Logback layout is to extend LayoutBase<T> and
implement a doLayout method. A skeletal implementation using the Jackson
library could look like this:
public class JsonLinesLayout extends LayoutBase<ILoggingEvent> {

    private static final ObjectMapper mapper = new ObjectMapper();

    static {

        // Hide null values from logs
        mapper.setSerializationInclusion(JsonInclude.Include.NON_NULL);

        // Json arrays elements on new lines
        var prettyPrinter = new DefaultPrettyPrinter()
            .withArrayIndenter(SYSTEM_LINEFEED_INSTANCE)
            .withObjectIndenter(SYSTEM_LINEFEED_INSTANCE);

        mapper.setDefaultPrettyPrinter(prettyPrinter);

    }

    private boolean prettyPrint;

    public void setPrettyPrint(boolean prettyPrint) {
        this.prettyPrint = prettyPrint;
    }

    @SneakyThrows
    @Override
    public String doLayout(ILoggingEvent event) {
        var json = Map.of("message", event.getFormattedMessage());
        var writer = prettyPrint ? mapper.writerWithDefaultPrettyPrinter() : mapper.writer();
        return writer.writeValueAsString(json) + "\n";
    }
}
The implementation only prints the message of the log. The next step is to parse the pattern of logged properties so that we can construct a JSON string as specified by the configuration:
...
  <layout class="net.keksipurkki.demos.logging.JsonLineLayout">
    <pattern>%date{yyyy-MM-dd'T'HH:mm:ssXXX,Europe/Helsinki} %logger %highlight(%level) %message %ex{short} %n</pattern>
    <prettyPrint>${app.logs.prettyPrint:-true}</prettyPrint>
  </layout>
...
Sounds daunting but luckily we can extend PatternLayout that has this
functionality already in place
public class JsonLinesLayout extends PatternLayout {

  ...

    private Converter<ILoggingEvent> head;

    @Override
    public void start() {

        if (getPattern() == null || getPattern().isEmpty()) {
            addError("Empty or null pattern.");
            return;
        }

        var p = new Parser<ILoggingEvent>(getPattern());

        if (this.getContext() != null) {
            p.setContext(this.getContext());
        }

        this.head = p.compile(p.parse(), getEffectiveConverterMap());

        ConverterUtil.setContextForConverters(this.getContext(), this.head);
        ConverterUtil.startConverters(this.head);
    }

  ...

}
The end result is that we store a head converter as a field. It represents the
head of a linked list of converters parsed from a pattern string like the one
shown above.
The native PatternLayout is implemented so that it just concatenates all the
converted values to a string:
StringBuilder strBuilder = new StringBuilder(256);

for (var c = this.head; c != null; c = c.getNext()) {
    c.write(strBuilder, event);
}

return strBuilder.toString();
In our case, the situation is a bit more complicated because we want to construct an intermediate map that is then serialized to a JSON string.
var json = new HashMap<String, Object>();

for (var c = this.head; c != null; c = c.getNext()) {
    var key = "?"; // Figure out the key?
    json.put(key, c.convert(event));
}

return json;
We would need to figure out a way to map instances of let’s say DateConverter
to the string date. The opposite can be realized very easily as the
PatternLayout implements a method getEffectiveConverterMap() that maps
date to DateConverter.class. The problem is that it also maps d to the
same thing. Similarly, the message of the log can be referenced with %m,
%msg or %message.
We can work around this issue by constructing a mapping table
CONVERTER_CLASS_TO_KEY as follows:
private static final Map<String, String> CONVERTER_CLASS_TO_KEY = new HashMap<>();
...

BinaryOperator<String> longerString = (a,b) -> a.length() > b.length() ? a : b;

for (var entry : getEffectiveConverterMap().entrySet()) {
    CONVERTER_CLASS_TO_KEY.putIfAbsent(entry.getValue(), entry.getKey());
    CONVERTER_CLASS_TO_KEY.computeIfPresent(entry.getValue(), (_k, v) -> longerString.apply(v, entry.getKey()));
}
The map will use the longest field name found from the effective converter map.
Now we can determine the field name with a lookup to CONVERTER_CLASS_TO_KEY.
Well, not quite. Turns out that the converters can be nested like in the case
%highlight(%level) so we have to extract the leaf converter:
private <E> Converter<E> leafConverter(Converter<E> converter) {
  if (converter instanceof CompositeConverter<E> composite) {
    return leafConverter(composite.getChildConverter());
  } else {
    return converter;
  }
}
Putting these two together yields:
var key = CONVERTER_CLASS_TO_KEY.get(leafConverter(converter).getClass().getName());
and our revised doLayout method becomes:
@SneakyThrows
@Override
public String doLayout(ILoggingEvent event) {
    var json = doJsonLayout(event);
    var writer = prettyPrint ? mapper.writerWithDefaultPrettyPrinter() : mapper.writer();
    return unescape(writer.writeValueAsString(json)) + "\n";
}

private Map<String, Object> doJsonLayout(ILoggingEvent event) {

    var json = new HashMap<String, Object>();

    for (var c = this.head; c != null; c = c.getNext()) {
        var key = CONVERTER_CLASS_TO_KEY.get(leafConverter(c).getClass().getName());
        json.put(key, c.convert(event));
    }

    return json;

}

private String unescape(String input) {
    var ESCAPE_KEY = "\u001B";
    return input.replaceAll("\\\\u001B", ESCAPE_KEY);
}
The unescape method restores colored output that gets garbled by JSON
serialization. I looked for hours for a library that would know how to convert
those annoying color codes like \u001B[34m to something that the console
understands. Turns out that \u001B stands for the ESC key. All I had to do is
replace all the escaped escape characters with the real thing.
JSON in JSON
At this point the output from the custom JSON layout looks decent enough but is still lacking when the message itself is a JSON string:
{"level":"INFO","message":"Handling request. Method = GET. URI = http://localhost:8080/hello-world"}
{"level":"INFO","message":"{\"message\":\"Hello world!\"}"}
The irony is that this is a tricky problem even though the JSON format is
specifically designed with nesting in mind. The root cause is that the SLFJ4 API
and Java itself come from an era before the rise of JSON. Imagining if Java had
native support for JSON, one could simply extend the SLFJ4 API to have methods
like <P extends JsonSerializable> void info(String message, P payload) and be
happy. Instead, the APIs are currently geared towards interpolating values to
more or less free format strings that are intended to be read by a human being,
typically a sysadmin in some dim-lit room of unspecified location.
Limiting myself to the constraints of the SLFJ4 API, I settled for a solution that is based on a custom log marker:
public static final Marker JSON_MESSAGE = MarkerFactory.getMarker("JSON_MESSAGE");
The calling code would then look like this:
var resp = new JsonObject() // From the Vert.x framework
        .put("message", "Hello world!");

log.info(JSON_MESSAGE, resp.encode()); // JSON serialization happens here
And the JsonLineLayout class is modified to treat JSON_MESSAGEs like so:
private Map<String, Object> doJsonLayout(ILoggingEvent event) {
    var json = new HashMap<String, Object>();

    for (var c = head; c != null; c = c.getNext()) {

        var leaf = leafConverter(c);
        var key = jsonLineKey(leaf);

        if (leaf instanceof LineSeparatorConverter) {
            continue;
        }

        if (leaf instanceof MessageConverter m) {
            var value = m.convert(event);
            json.put(key, isJsonMessage(event) ? new RawValue(value) : value);
            continue;
        }

        if (nonNull(key)) {
            var value = c.convert(event);
            json.put(key, value);
        }
    }

    return json;

}

private boolean isJsonMessage(ILoggingEvent event) {
    return nonNull(event.getMarkerList()) && event.getMarkerList().contains(JSON_MESSAGE);
}
The RawValue wrapper class comes from Jackson and instructs the library to
skip serialization and escaping. The output will then be what we want:
{"level":"INFO","message":"Handling request. Method = GET. URI = http://localhost:8080/hello-world"}
{"level":"INFO","message":{"message":"Hello world!"}}
Request correlation
A log analysis usually starts with getting all the logs of a given request. Further, it is often necessary to get a trace of the logs across multiple applications. In practice, the applications need to look for certain HTTP headers and pass them on to service requests they make themselves.
Request correlation can be approached in a manual fashion but this makes for a brittle system. It is much better if the system uses some kind of a general approach that handles the request correlation logic for you. In other words, request correlation is a cross-cutting concern.
OpenTelemetry is a solution like that, although
truth to be told, the framework looks like a veritable tour de force of
over-engineering. To the extent that I understand the OpenTelemetry concepts,
the request traces are identified by traceIds which further break down to
spans identified by their spanIds. As for the HTTP headers themselves, one
should study the W3C Trace Context
specification.
As I only have experience with OpenTelemetry in conjunction with the Vert.x framework, I can only show you how it works using Vert.x. Luckily, the setup is very simple:
public class Main {

    private static final Logger log = LoggerFactory.getLogger(Main.class);

    public static void main(String... args) {

        log.info("Starting {}", Main.class);
        var sdkTracerProvider = SdkTracerProvider.builder().build();

        var openTelemetry = OpenTelemetrySdk.builder()
            .setTracerProvider(sdkTracerProvider)
            .setPropagators(ContextPropagators.create(W3CTraceContextPropagator.getInstance()))
            .buildAndRegisterGlobal();

        var opts = new VertxOptions()
            .setTracingOptions(new OpenTelemetryOptions(openTelemetry));

        var vertx = Vertx.vertx(opts);

        // ... instantiate the application using the configured Vert.x instance
    }
}
The code depends on the following artifacts
<!-- Vert.x -->
<dependency>
  <groupId>io.vertx</groupId>
  <artifactId>vertx-core</artifactId>
</dependency>

<!-- OpenTelemetry -->
<dependency>
  <groupId>io.opentelemetry</groupId>
  <artifactId>opentelemetry-sdk</artifactId>
  <version>1.28.0</version>
</dependency>
<dependency>
  <groupId>io.vertx</groupId>
  <artifactId>vertx-opentelemetry</artifactId>
</dependency>
That’s it as far as application code is concerned. As there should be only one
Vert.x instance in a Vert.x application, the framework is able to inject
OpenTelemetry hooks to all the necessary parts of the application. The
OpenTelemetry identifiers can be accessed from Span.current().getSpanContext()
where the Span class comes from the OpenTelemetry SDK.
The remaining piece of the puzzle is to have Logback output the correlation identifiers. After looking for inspiration from community contributions, I came up with a solution that is based on implementing a custom Logback converter:
  <conversionRule conversionWord="trace"
                  converterClass="net.keksipurkki.demos.logging.OpenTelemetryConverter"/>
  ...

  <layout class="net.keksipurkki.demos.logging.JsonLineLayout">
    <pattern>%trace{traceId} %trace{spanId} ...</pattern>
    <prettyPrint>${app.logs.prettyPrint:-true}</prettyPrint>
  </layout>
The implementation selects the identifier to extract based on the first option passed in the configuration XML:
public class OpenTelemetryConverter extends ClassicConverter {

    final private Map<String, Supplier<String>> suppliers = Map.of(
        "spanId", this::getSpanId,
        "traceId", this::getTraceId
    );

    private Supplier<String> supplier;

    @Override
    public void start() {
        supplier = suppliers.getOrDefault(getFirstOption(), () -> "");
    }

    @Override
    public String convert(ILoggingEvent iLoggingEvent) {
        return supplier.get();
    }

    private String getTraceId() {
        return Span.current().getSpanContext().getTraceId();
    }

    private String getSpanId() {
        return Span.current().getSpanContext().getSpanId();
    }

}
Conclusion
There you have it. The full source code of the demo application is available on GitHub and contains a couple of extra tweaks not discussed in this blog.
Speaking from my own experience, having machine-readable logs makes a world of difference and opens the avenue to further automate work. As already discussed in the 12 factor app manifest, the application logs should be treated as an event stream. I can easily imagine lots of applications that would be designed to specifically consume these streams in order to produce some result, say a business intelligence report for example.